Bicycle lanes are always empty!
Why should we invest more into infrastructure which nobody uses?
-
Argument
Bicycle lanes are a waste of space. They are always empty while cars are stuck in traffic. Instead of catering to a tiny fraction of cyclists, these lanes should be reclaimed for the countless drivers who use the roads every day.
-
Rebuttal
The Network Effect
Bike lanes might seem underused at first glance, but this can be due to a number of factors. For example, if they do not connect to a wider, more integrated network they will not be utilised. Cyclists, like drivers, need continuous and cohesive routes to reach their destinations efficiently. When bike lanes are isolated segments, they do not serve the needs of cyclists, who then opt for more direct but potentially dangerous routes on regular roads. By expanding and connecting these lanes, cities can create a more inviting and practical system for cyclists, encouraging greater usage. This effect has been demonstrated in studies which have researched this network effect. One study which looked at 74 cities in the US found that Bicycle commuting is most sensitive to changes in network density. A change in the density factor score from 0 to 1 (or one standard deviation) corresponds to a 77 % increase in rates of bicycle commuting. Increasing a city’s connectivity score or fragmentation score from 0 to 1 is associated with about a 20 % increase in biking, and the same change in directness corresponds to a 27 % change in the dependent variable.
.The Spanish city of Seville, with a population of 700,000, provides an excellent case study of this network effect. In the first half of the 2000s, the city government of Seville made the decision to build out a bicycle network. In 2004, the network consisted of just a few, short and disconnected pieces, totalling approximately
. The network (see. In the following years, a plan was devised to create a fully connected network, bringing people close to the places they want to frequently visit. The plan was developed quickly and by 2007 had already been constructed. By 2010, an extensive cycling network span the city ) was a resounding success, with trips by bicycle quintupling from 13,000 per day in 2006 to over 68,000 per day in 2010 all while reducing bicycle traffic injuries from 1.812 per 100,000 trips in 2006 to just 0.545 per 100,000 trips in 2011 . By 2011, there was a notable decrease in the modal share of cars , which indicates that citizens of Seville had begun using bicycles as a serious alternative to cars as a mode of transportation in their daily lives. The Four Types of Cyclists
Safety is another critical factor that can deter cyclists from using designated lanes. Many bike lanes are either too narrow or insufficiently separated from vehicular traffic, making them hazardous and unappealing. For context, in the US, the recommended bicycle lane width ranges from
. In contrast, the Netherlands recommends a minimum width ofto , extending up to . Without physical barriers or adequate width, cyclists are left vulnerable to accidents and collisions. Adding features like bollards or increasing the width of bike lanes can make them much safer, encouraging more people to use them. In 2006, the bicycle coordinator of the Portland Office of Transportation proposed four categories to classify people’s attitudes towards cycling
:- Strong and Fearless: Cyclists who ride comfortably on any street, even busy ones, without needing bike-specific infrastructure.
- Enthused and Confident: Cyclists who are comfortable riding with cars and trucks but prefer dedicated bike lanes or facilities.
- Interested but Concerned: People who are curious about bicycling and want to ride but need comfortable, safe facilities and avoid streets with heavy traffic.
- No Way, No How: People who will not ride a bicycle regardless of street conditions due to various reasons such as inability, lack of interest, or other factors.
Initially, these groups were devised for the population in Portland. However, when tested in 2016 across the 50 largest metropolitan areas in the US with a sample size of 3,000 adults
, the results painted a very similar picture when compared to Portland (see). This suggests that these categories are likely to be more broadly applicable than just in Portland and the US, but more surveys in other countries would be needed to fully support this conclusion. These studies demonstrated that while the majority of people are willing to cycle, they require safe cycling infrastructure before they are comfortable doing so. Only a small percentage of those surveyed belonged to the “strong and fearless” group who ride regardless of conditions. In contrast, over 50% of respondents in each study expressed interest in cycling but did not feel comfortable due to the lack of safe infrastructure. figure 1 Overview of the share of the four types of cyclist in three studies, showing a consistent majority of "Interested but Concerned" individuals and a small percentage of "Strong and Fearless" cyclists across Portland and other US metropolitan areas. Data:Induced and Latent Demand Take Time
It takes time for demand to grow after a new bicle lane has been opened. It is therefore conceivable that a cycle lane may appear empty because it is new or has only recently been connected to the remaining network. This issue is discussed in more detail in another argument: "Just one more lane!" .
Spatial Efficiency
It is also important to remember that bike lanes can seem empty even when there are many cyclists using them, because even a large number of cyclists can move through a small area quickly making them appear less busy than they actually are. This is because on average a moving cyclist needs only
. The measure of how many people can be transported by various modes of transport is called “corridor capacity”. In short: a 3.5 m wide lane can transport 12,000 cyclists per hour but a car lane of the same width can only move about 2,000 people per hour . These different space requirements are visualised inof space while a car needs demonstrating how much space 30 people take up in cars, and how much 30 people take up on bicycles. 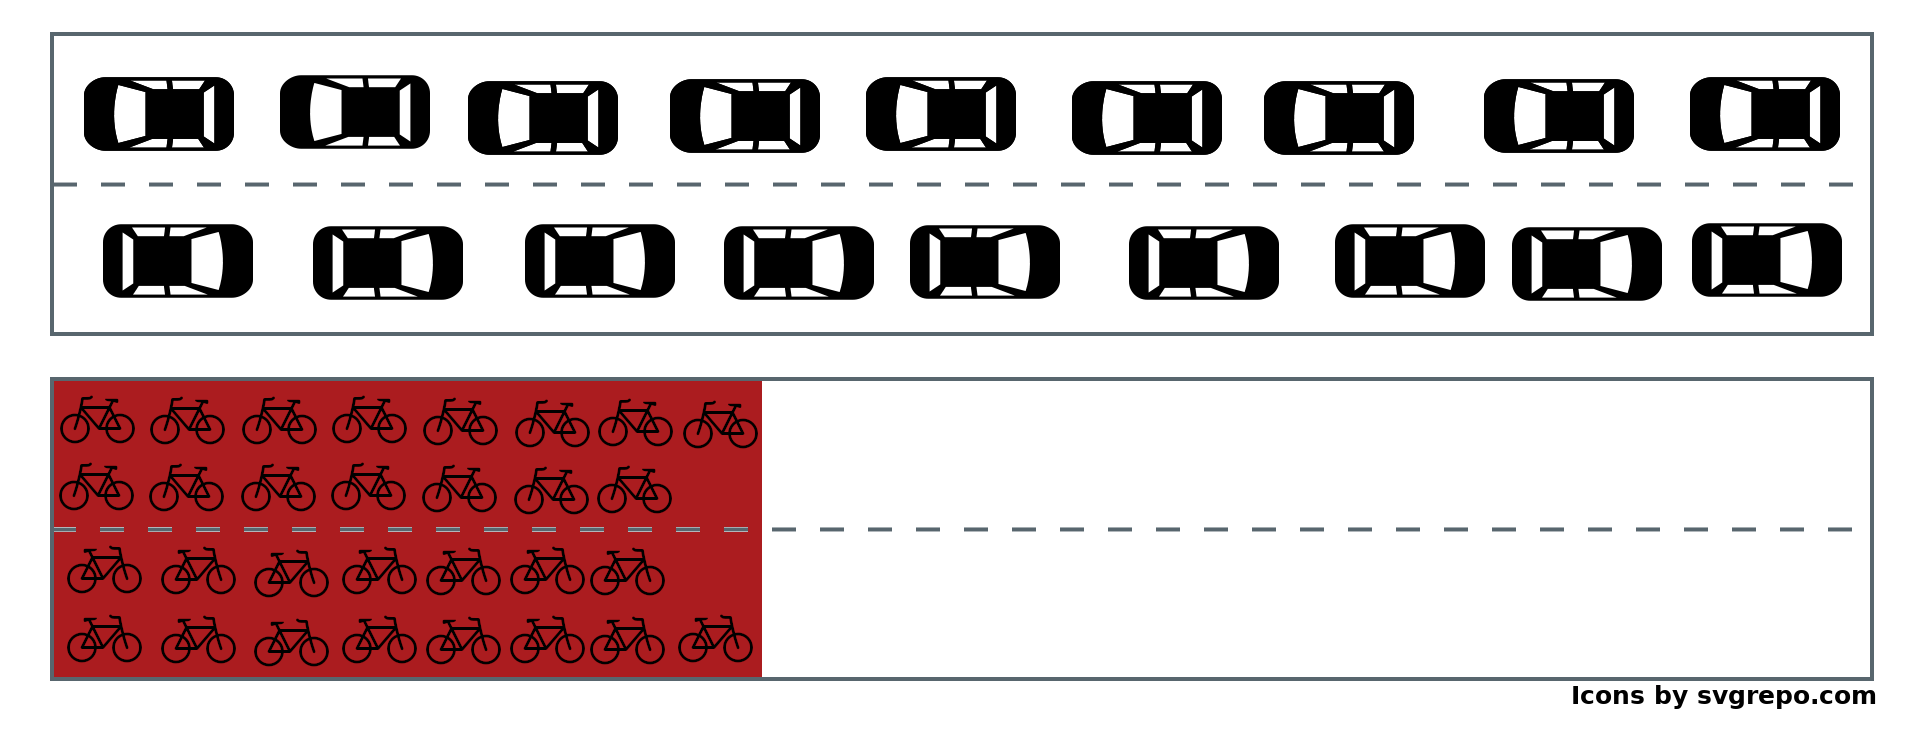
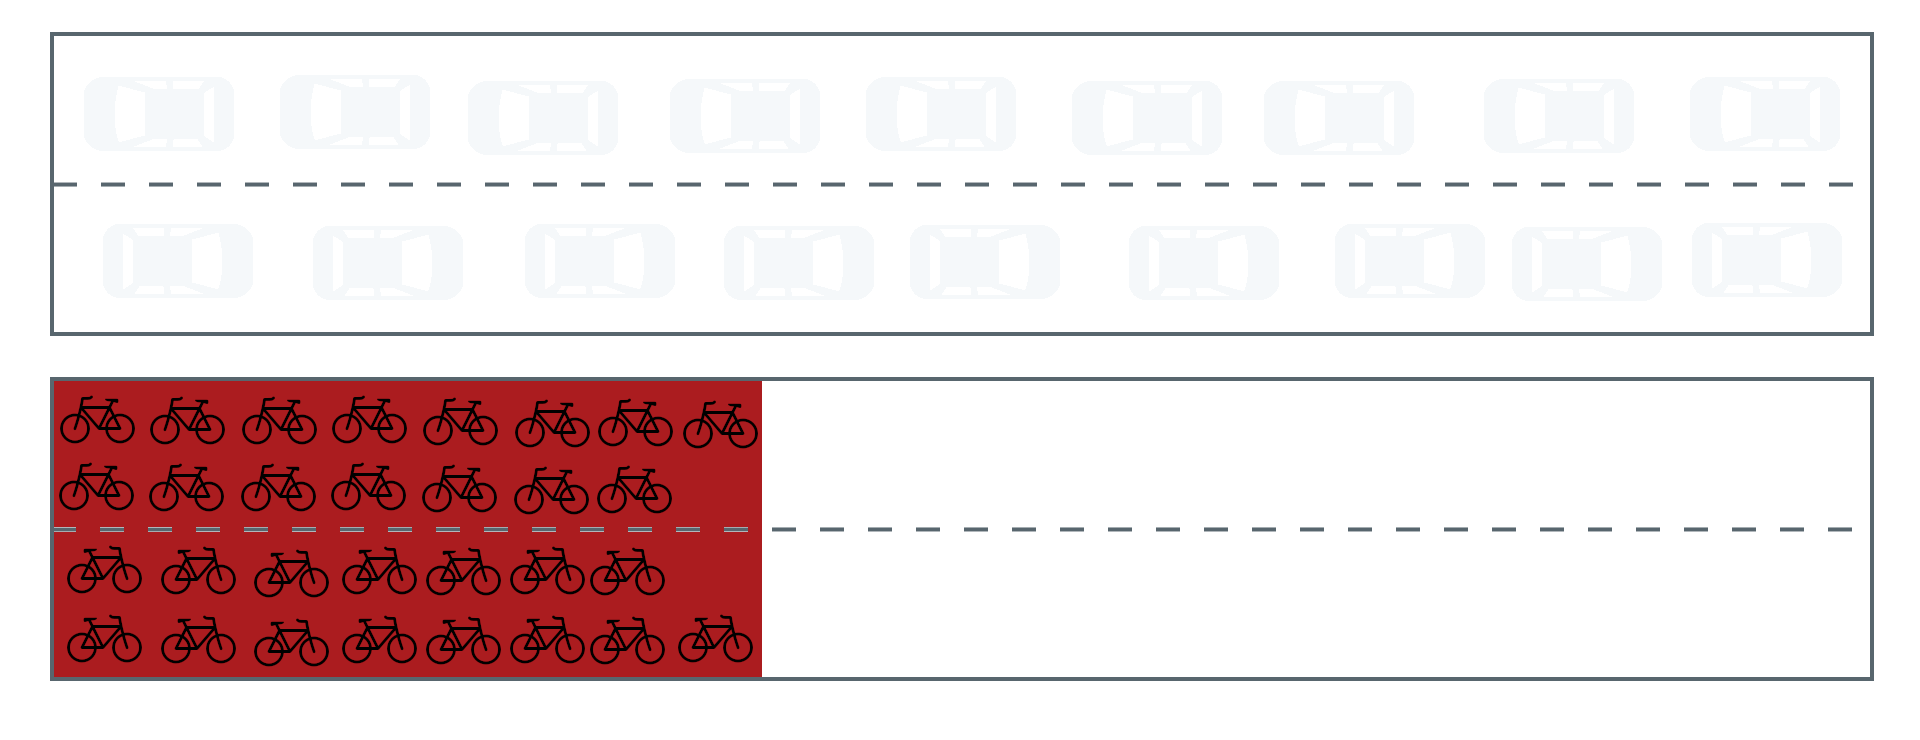 image 2 - Comparing the space requirements for 30 people travelling by car and 30 people travelling by bicycle, with each mode of transport using two
metre wide lanes in each travel direction. For car travel, it is assumed that there are 1.7 passengers per car . Space requirements for each mode are based on . -
Solution
There are various reasons why bicycle lanes can be empty or appear to be empty. Each bicycle lane is unique, so there may be legitimate reasons for their lack of apparent use. These reasons can include a lack of connection to the rest of the network, insufficient separation from cars, or being newly constructed. Additionally, they might actually be used frequently but appear less busy due to differing expectations based on past experiences as a car driver as to what a frequently used path looks like. When you encounter empty bicycle lanes, you need to examine the reasons behind their apparent emptiness. Do not immediately call for them to be removed. Instead, evaluate whether the number of cyclists can be increased, because this will lead to clearer streets for those who have no choice but to use a car, emergency services, tradespeople, truckers, and so on.
-
Bibliography
- [CROW, 2022] Geactualiseerde aanbevelingen voor de breedte van fietspaden 2022. https://fietsberaad.nl/Kennisbank/Aanbevelingen-breedte-fietspaden-2022
- [Dill & McNeil, 2016] Dill, J., McNeil, N. (2016). Revisiting the Four Types of Cyclists: Findings from a National Survey. Transportation Research Record, 2587, pp. 90-99. doi:10.3141/2587-11.
- [Fiorello et al., 2016] Fiorello, D., Martino, A., Christidis, P., Navajas-Cawood, E. (2016). Mobility Data across the EU 28 Member States: Results from an Extensive CAWI Survey. Transportation Research Procedia, 14, pp. 1104-1113. doi:10.1016/j.trpro.2016.05.181.
- [Geller, 2009] Four Types of Cyclists. https://www.portland.gov/sites/default/files/2022/Four%20Types%20of%20Cyclists%20updated%202009.pdf
- [Marquées et al., 2020] Marquées, R., Hernández-Herrador, V., Calvo-Salazar, M., García-Cebrián, J. (2020). How infrastructure can promote cycling in cities: Lessons from Seville. Research in Transportation Economics, 53, pp. 31-44. doi:10.1016/j.retrec.2015.10.017.
- [NCHRP, 2014] Recommended Bicycle Lane Widths for Various Roadway Characteristics. doi:10.17226/22350.
- [Pedalibre, 2018] Por Una Red Ciclista Para 2021. https://pedalibre.org/wp-content/uploads/2018/11/propuesta-de-red-ciclista-en-madrid-para-los-prc3b3ximos-2-ac3b1os-1.pdf
- [Schoner & Levinson, 2014] Schoner, J., Levinson, D. (2014). The missing link: bicycle infrastructure networks and ridership in 74 US cities. Transportation, 41, pp. 1187-1204. doi:10.1007/s11116-014-9538-1.
- [SUTP, 2004] SUTP Module 2a - Land Use Planning and Urban Transport. https://sutp.org/publications/land-use-planning-and-urban-transport
- [TUMI, 2021] Passenger Capacity of Different Transport Modes. https://transformative-mobility.org/wp-content/uploads/2021/09/Passenger-Capacity-of-different-Transport-Modes_light-bg.pdf